
Century 21 People’s Choice Realty Inc., Brokerage
120 MATHESON BLVD E #103
MISSISSAUGA, Ontario
L4Z 1X1


Toronto, Waterfront Communities C1, M5V 1K5
$774,900
Listed by RIGHT AT HOME REALTY BROKERAGE.
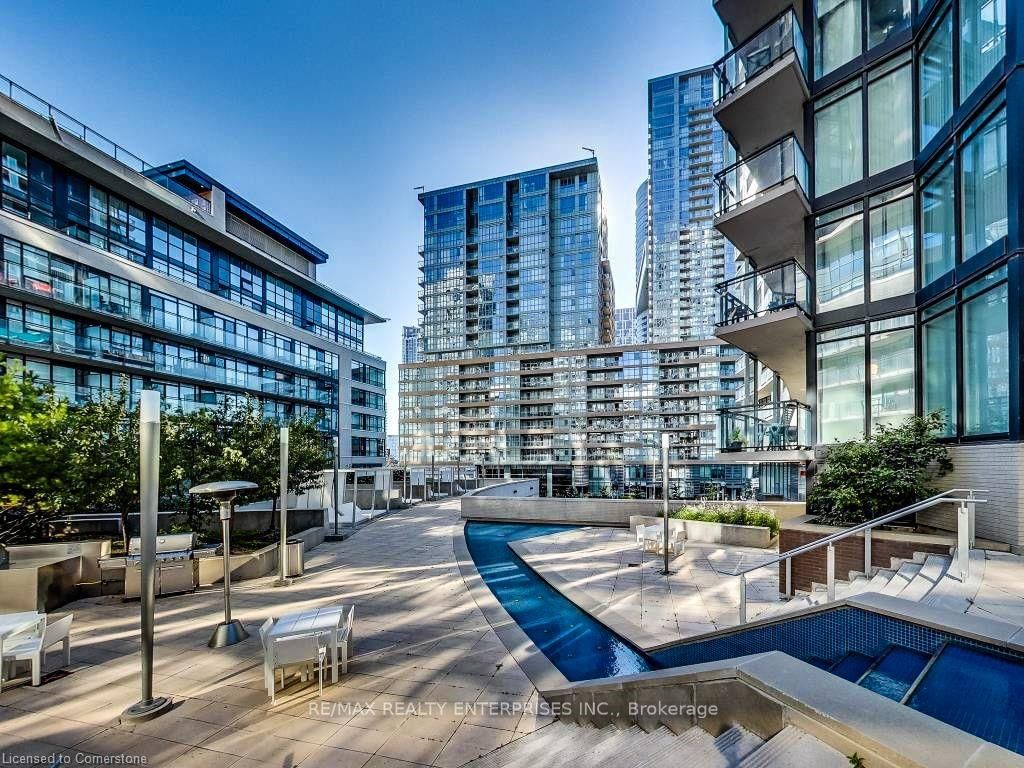
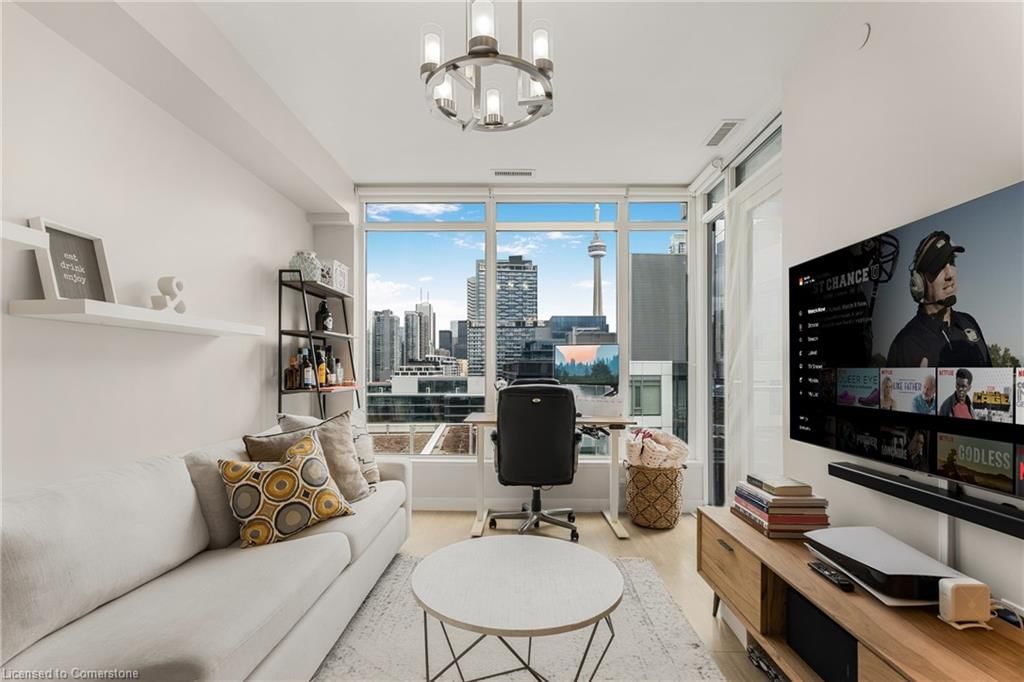
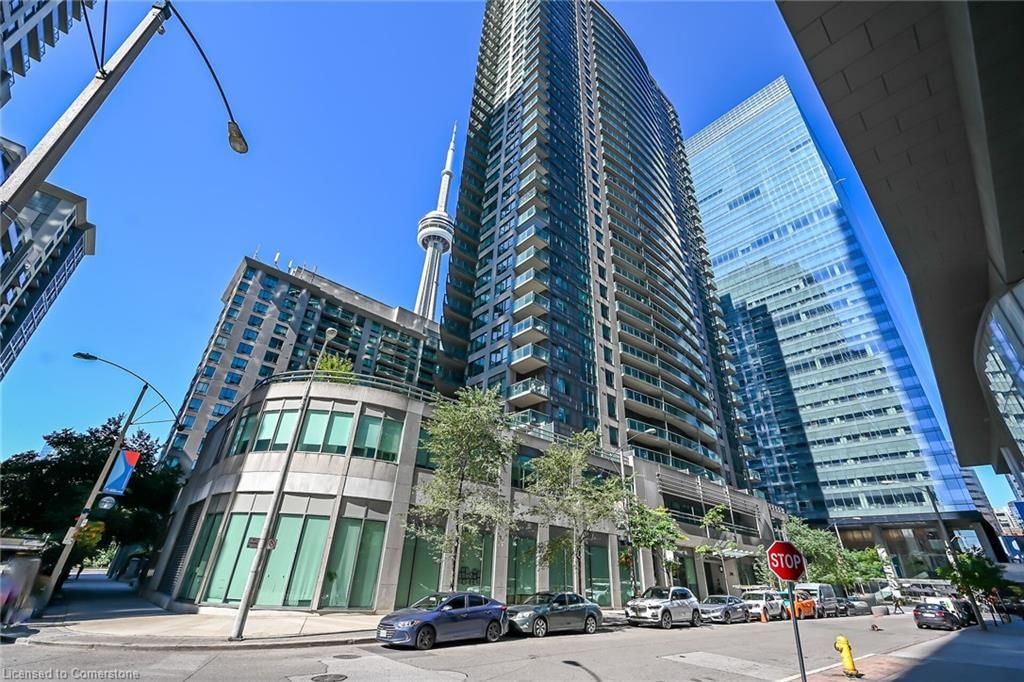
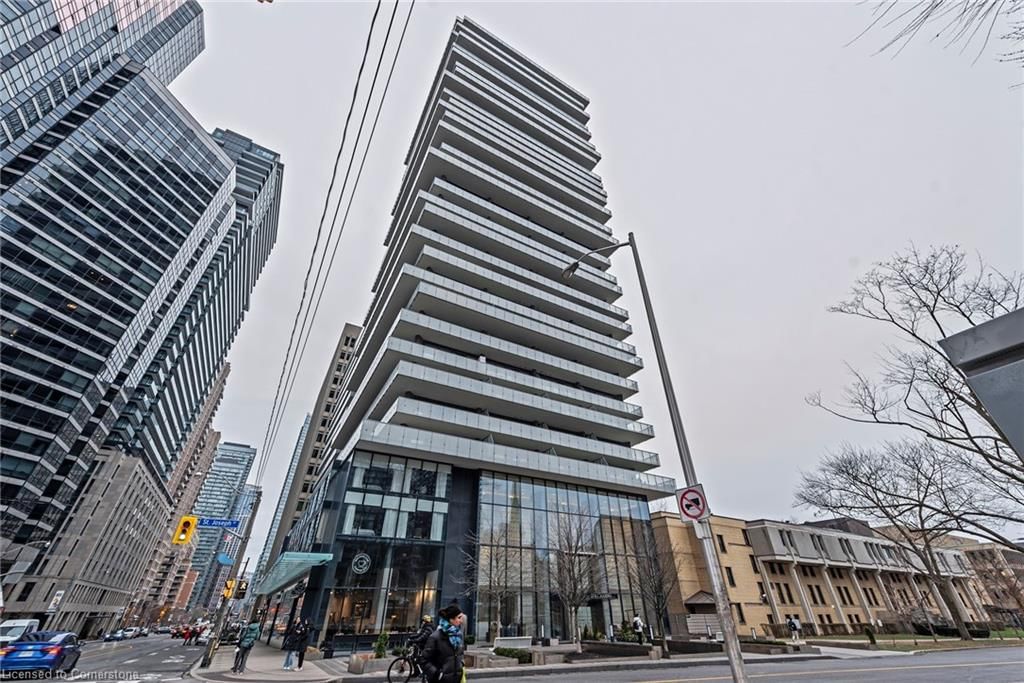
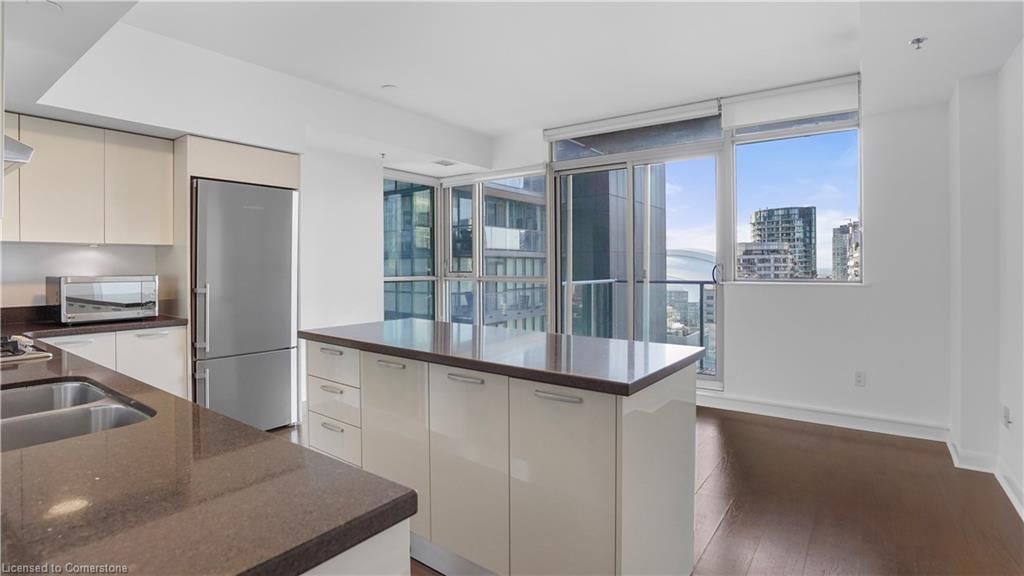
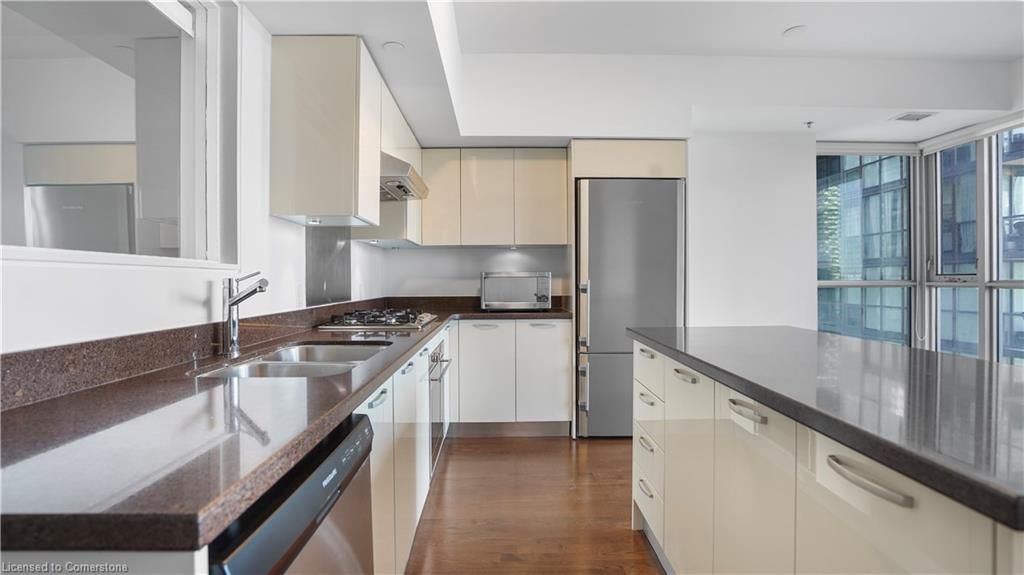
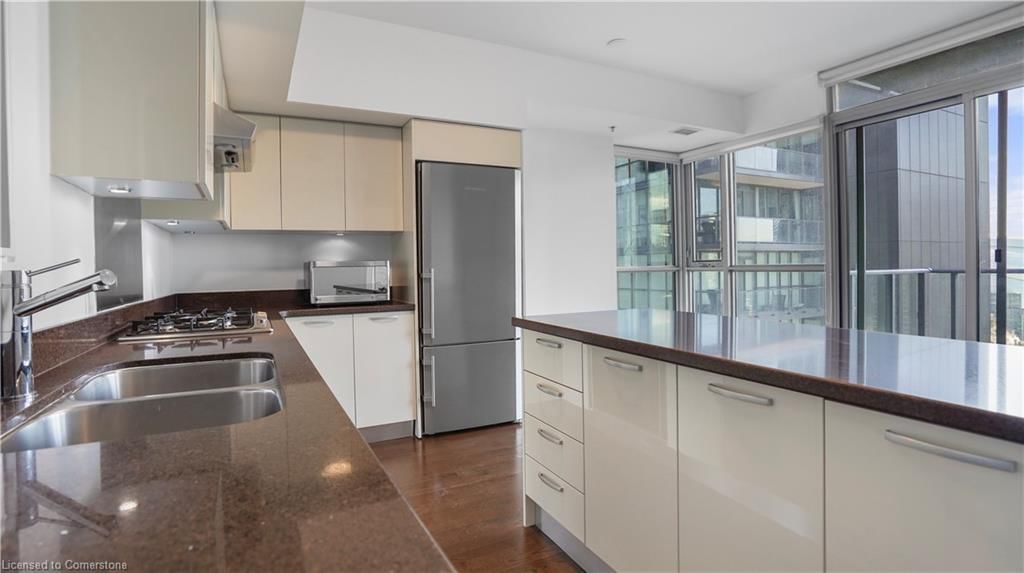
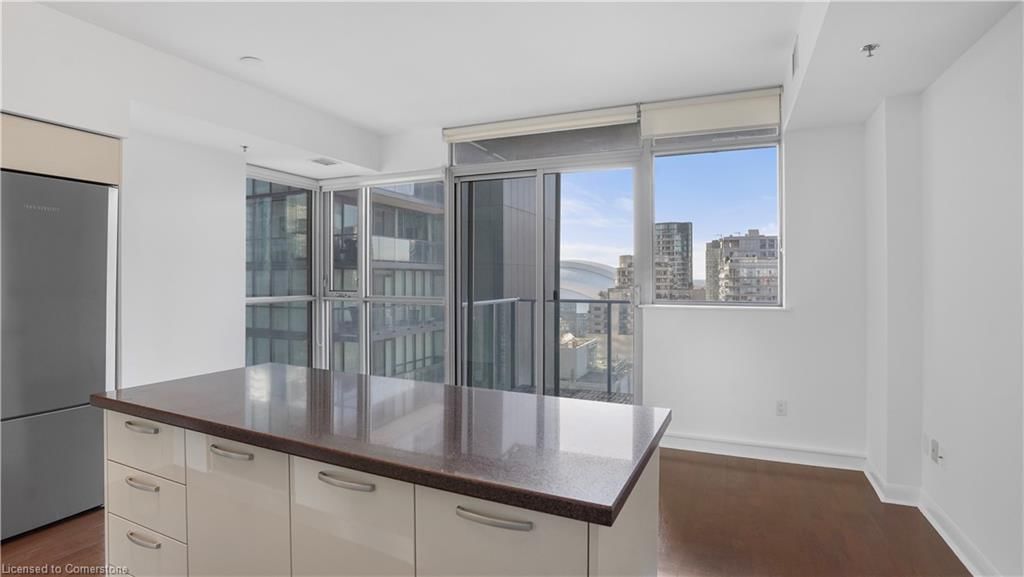
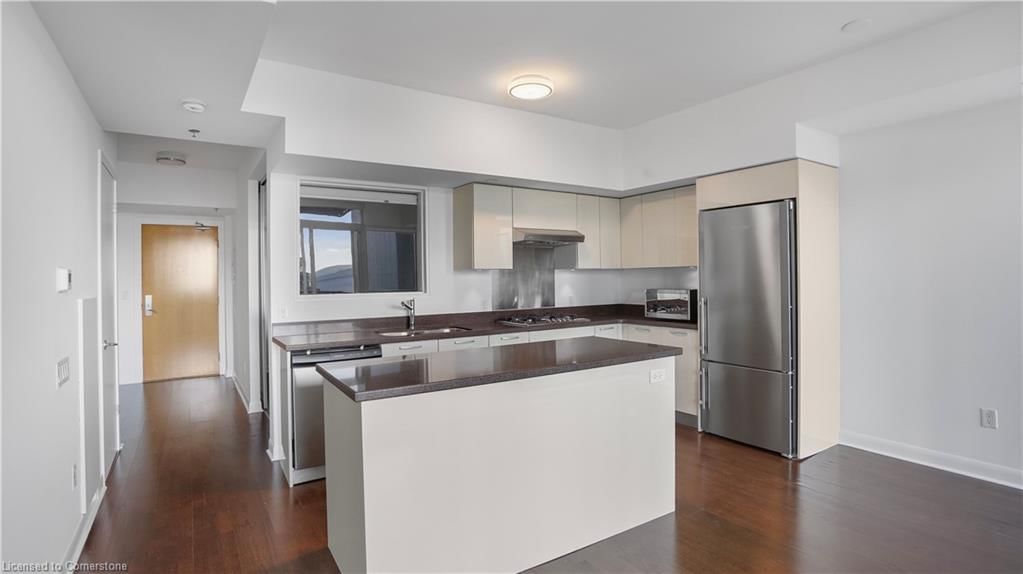
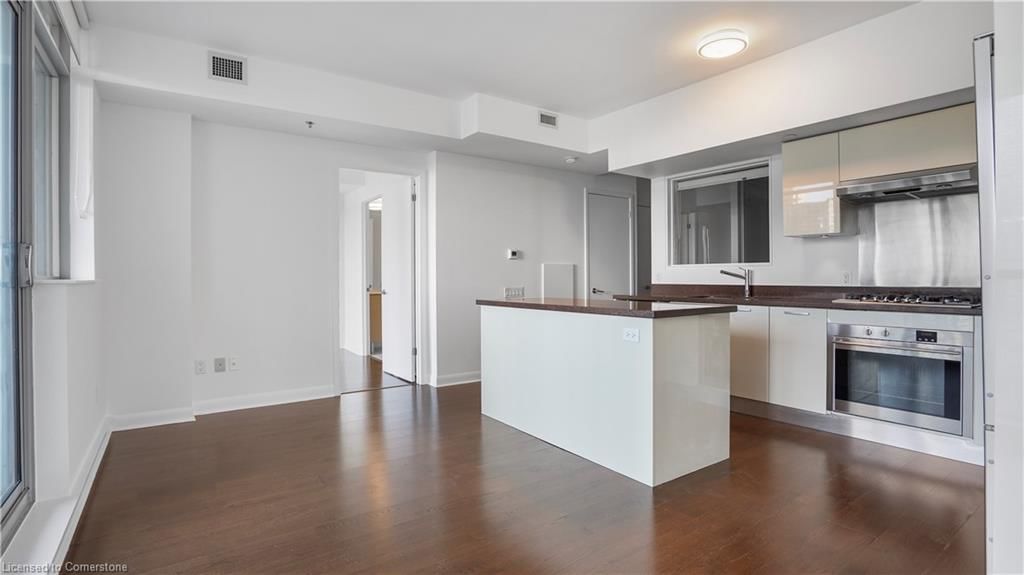
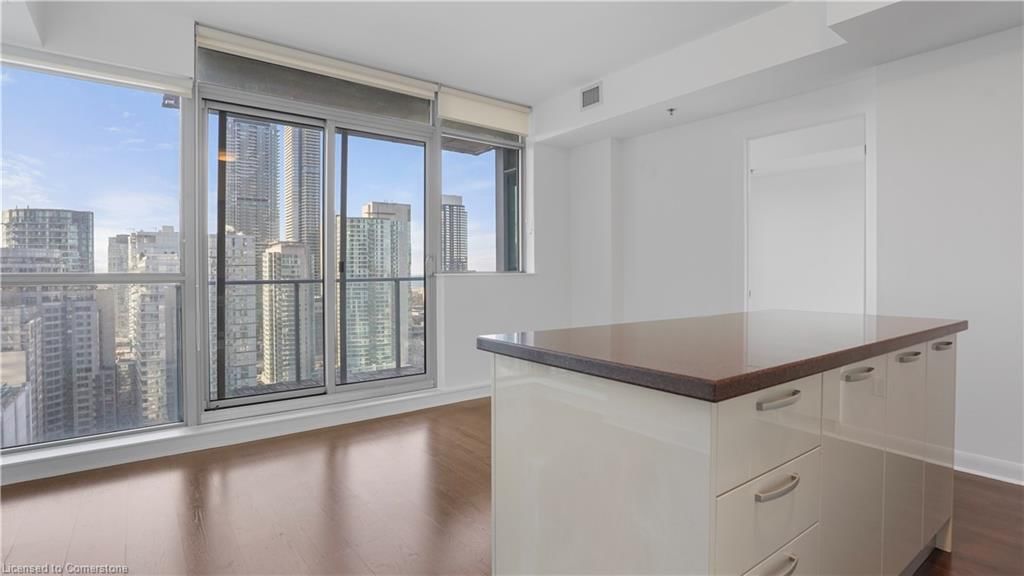
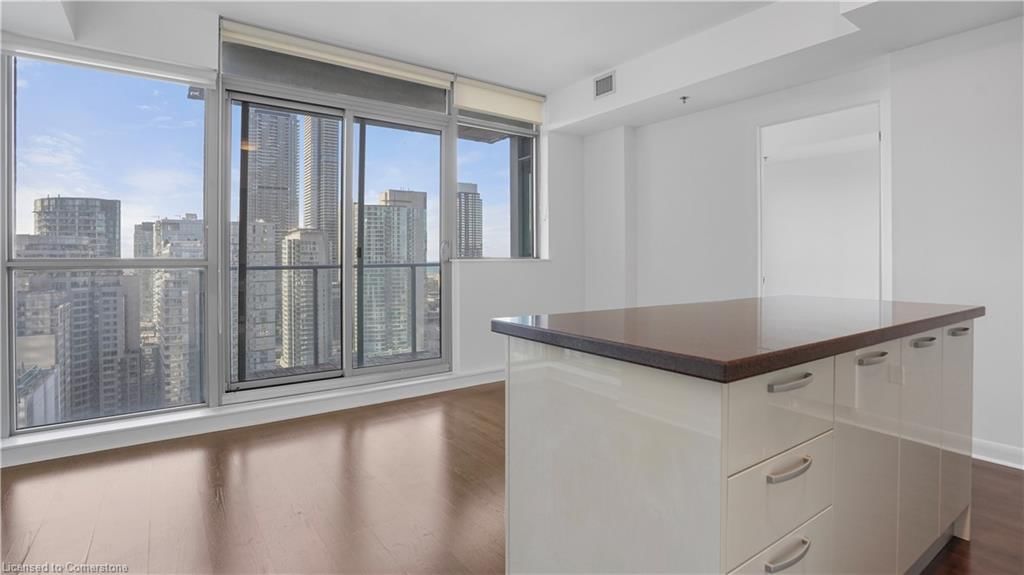
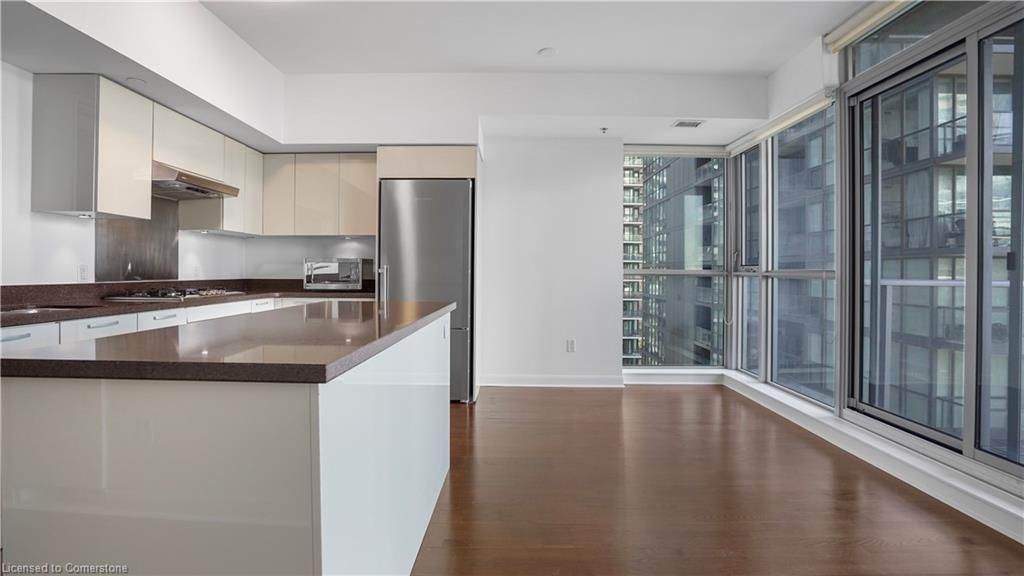
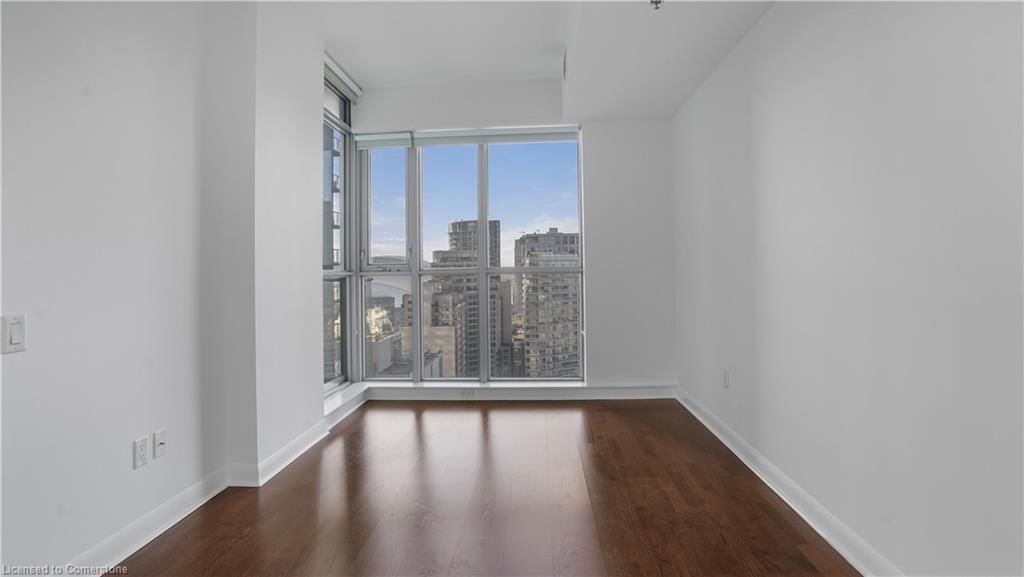
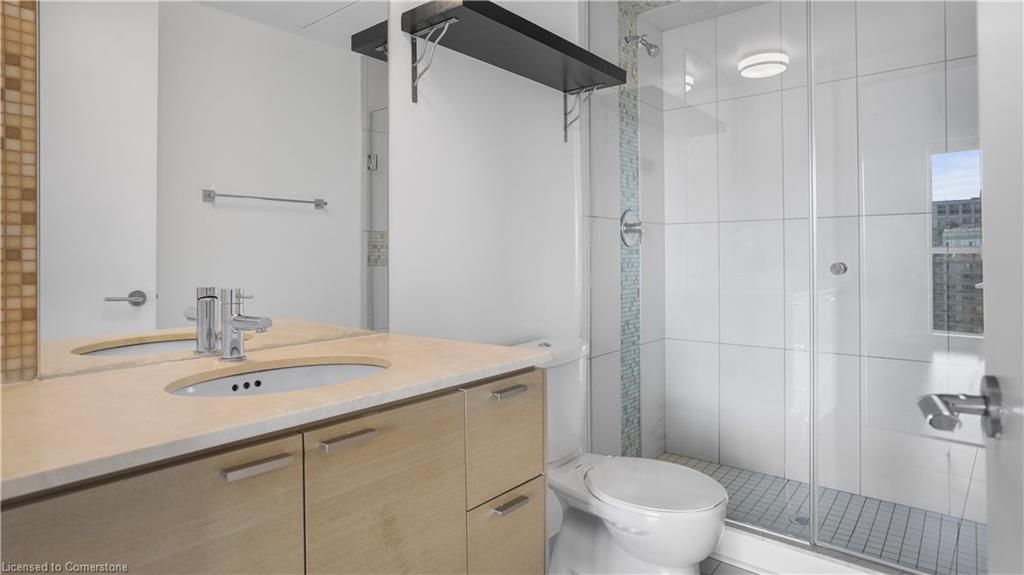
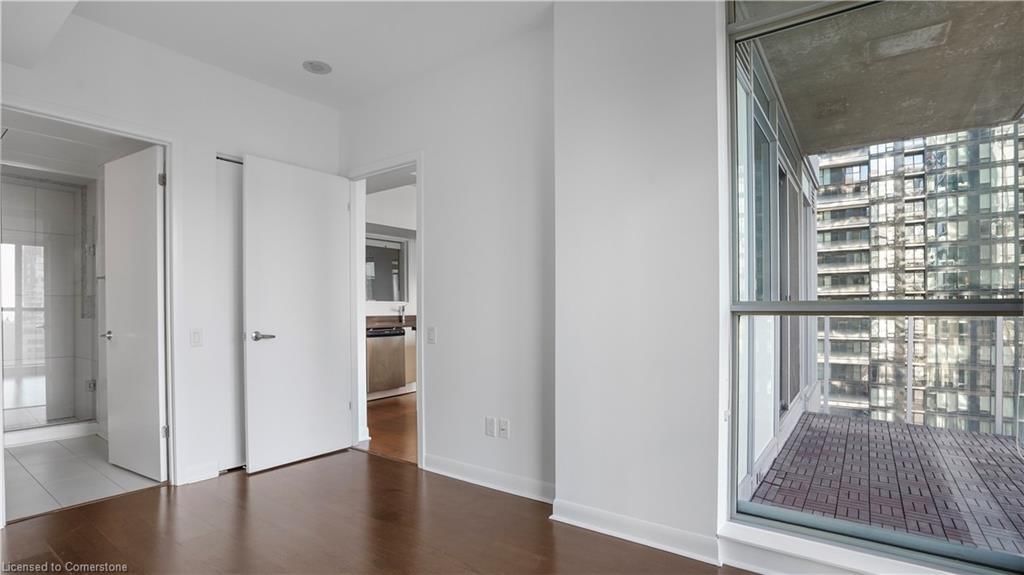
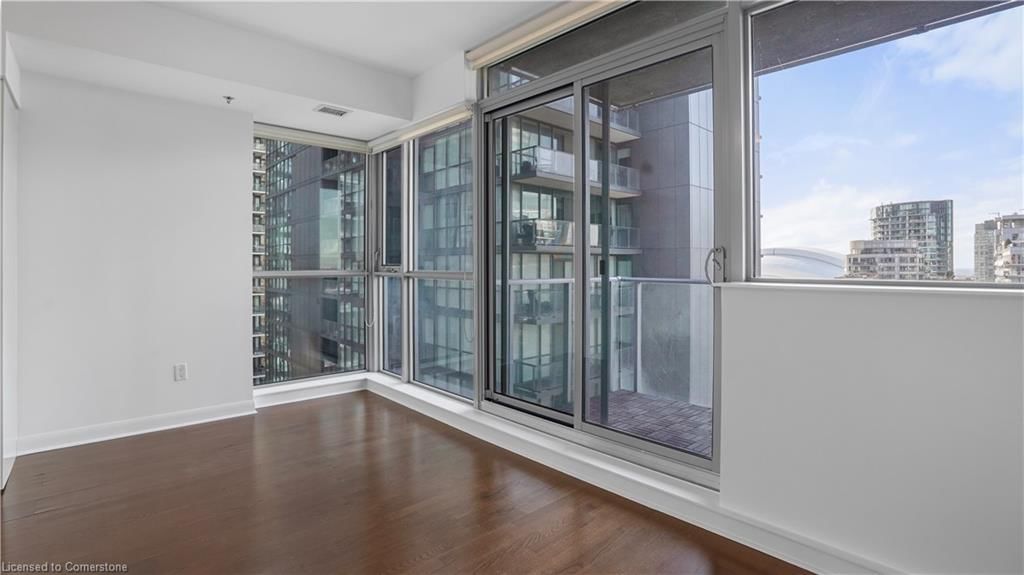
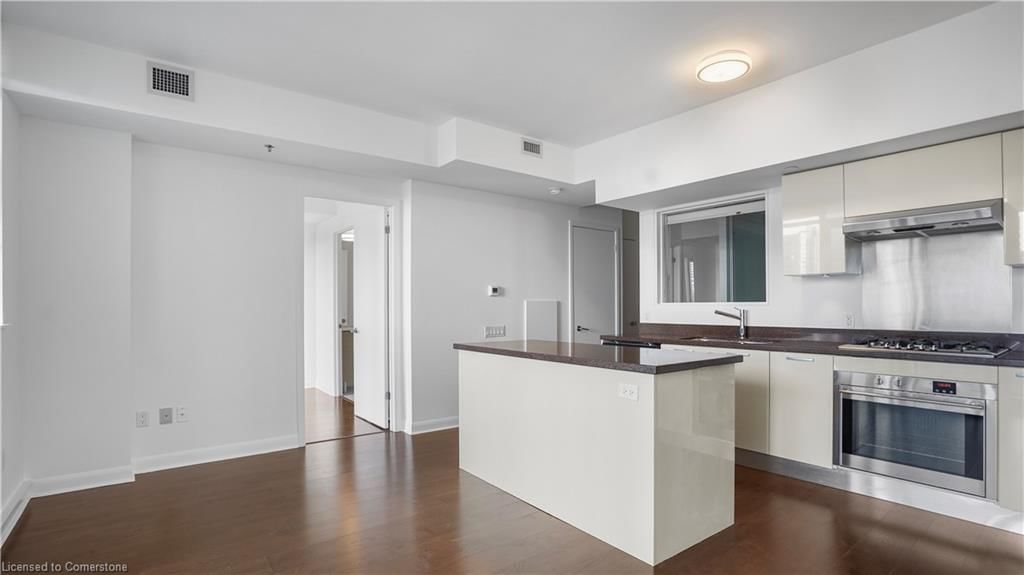
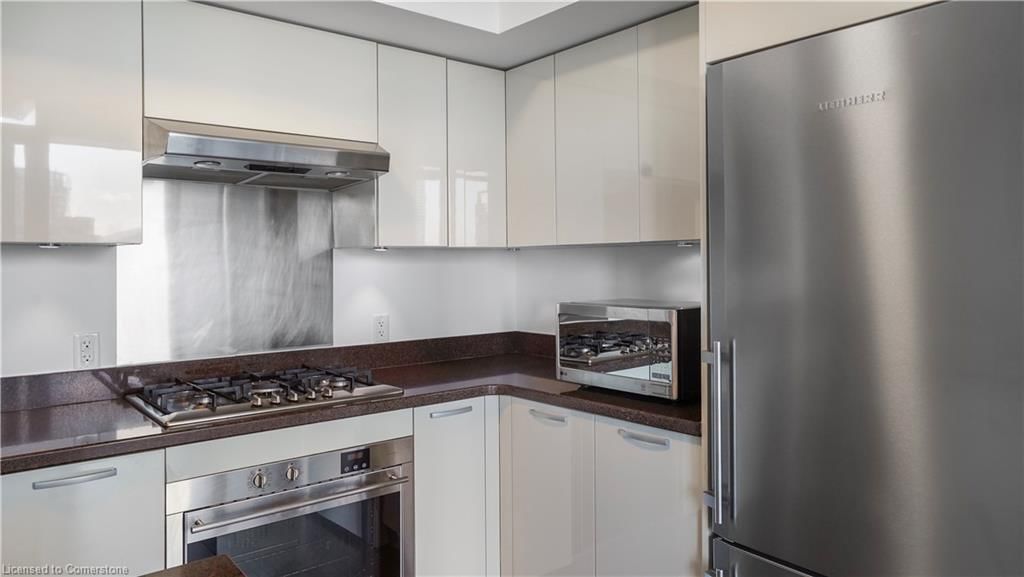
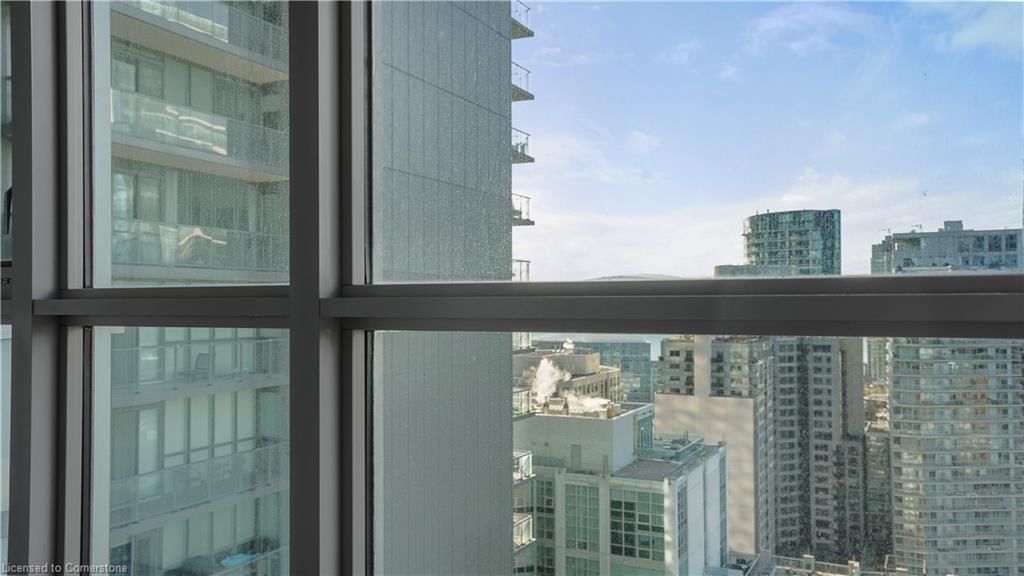
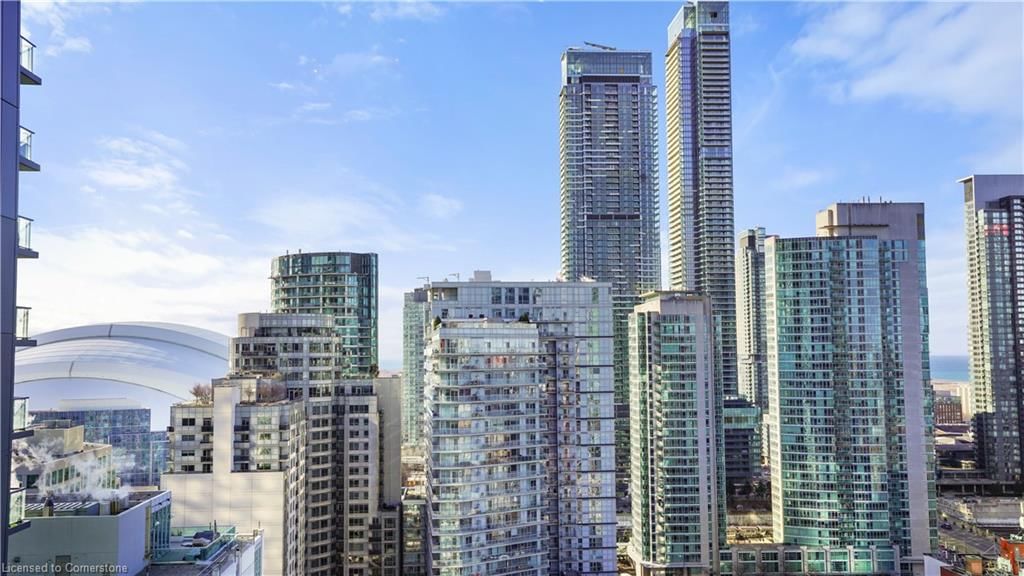
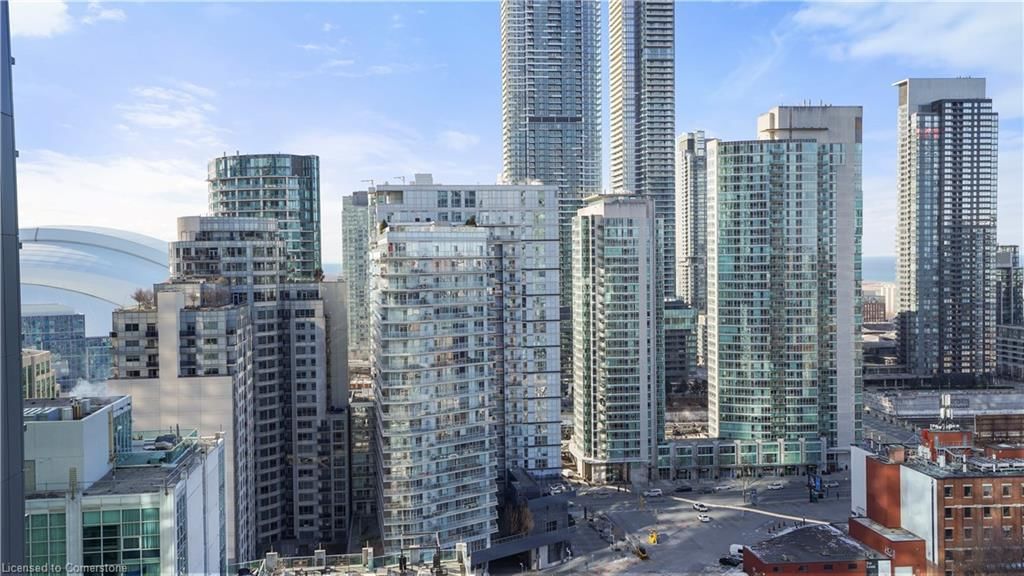
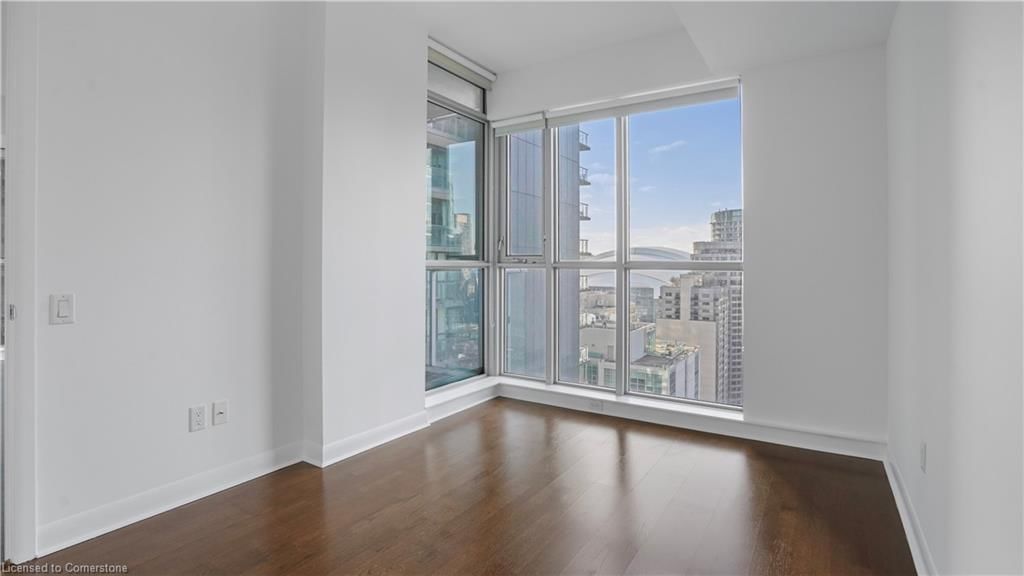
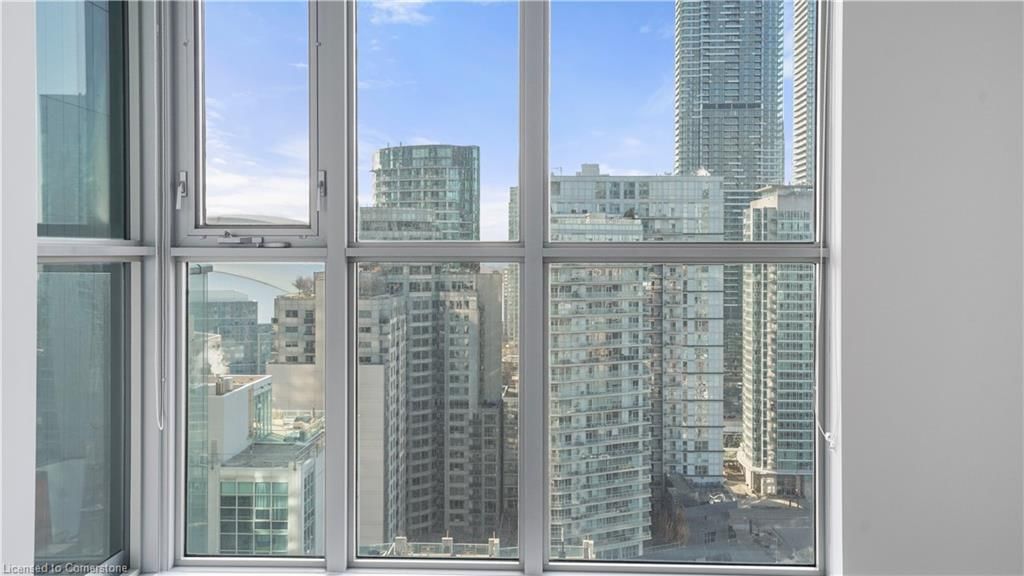
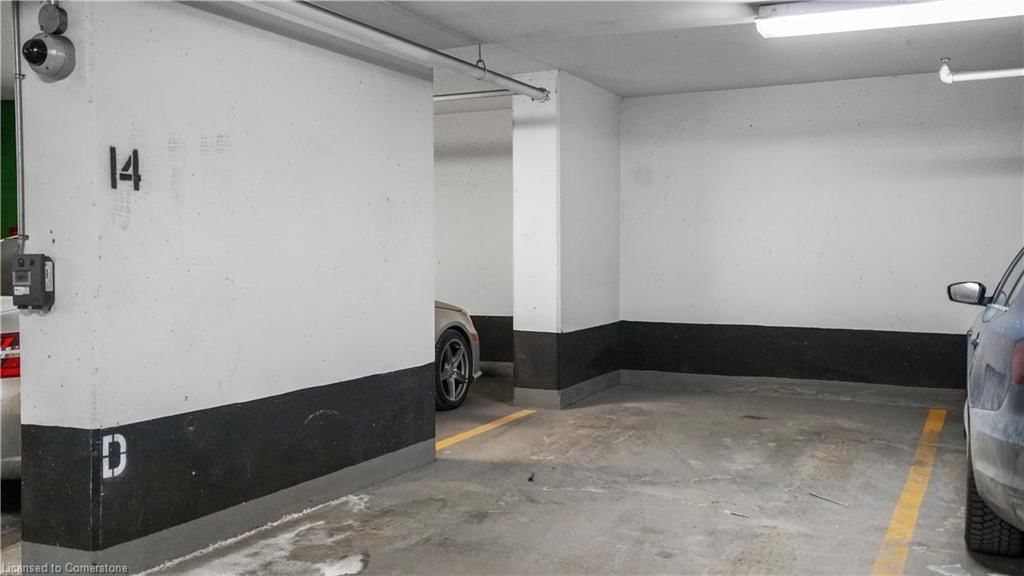
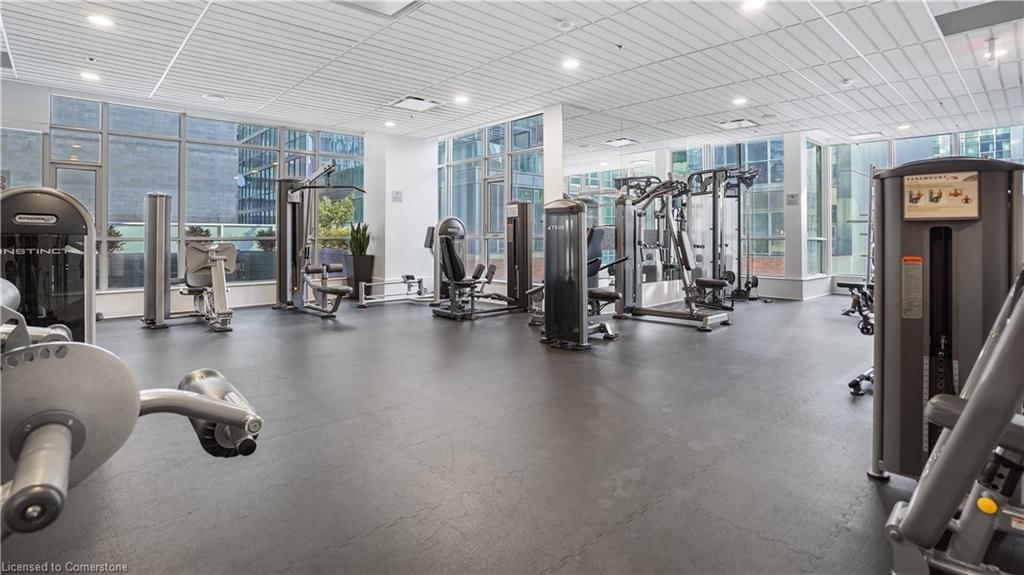
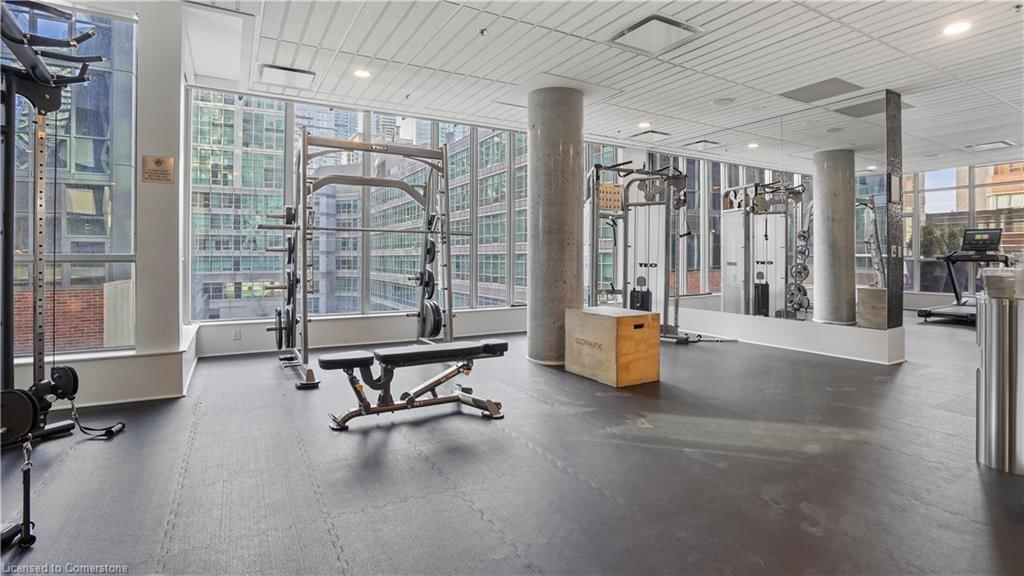
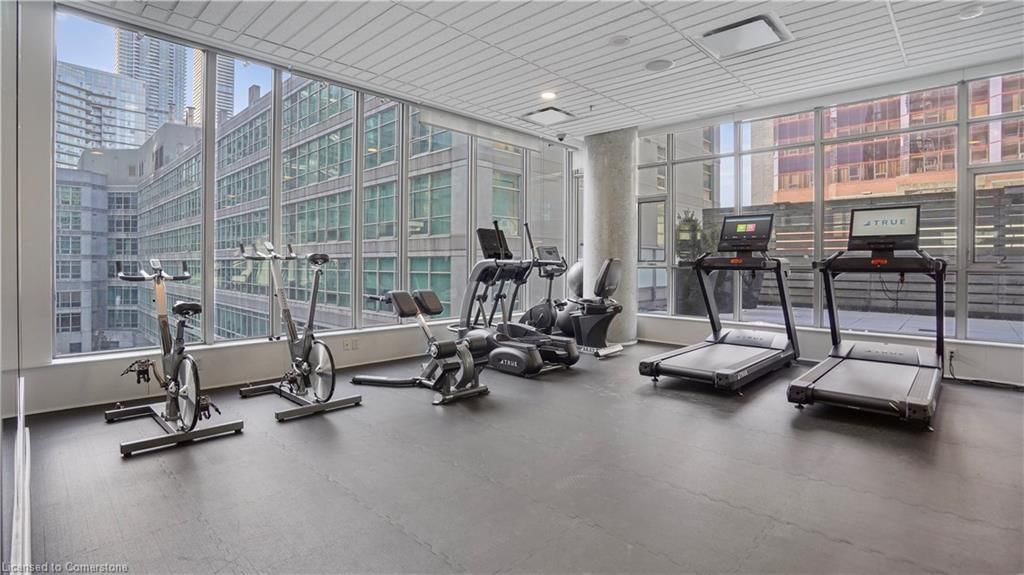
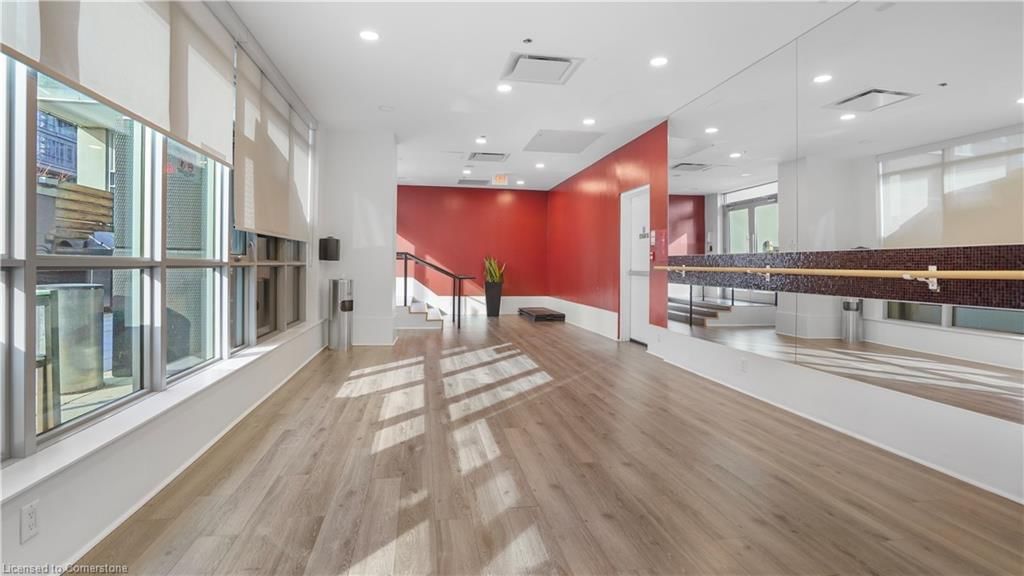
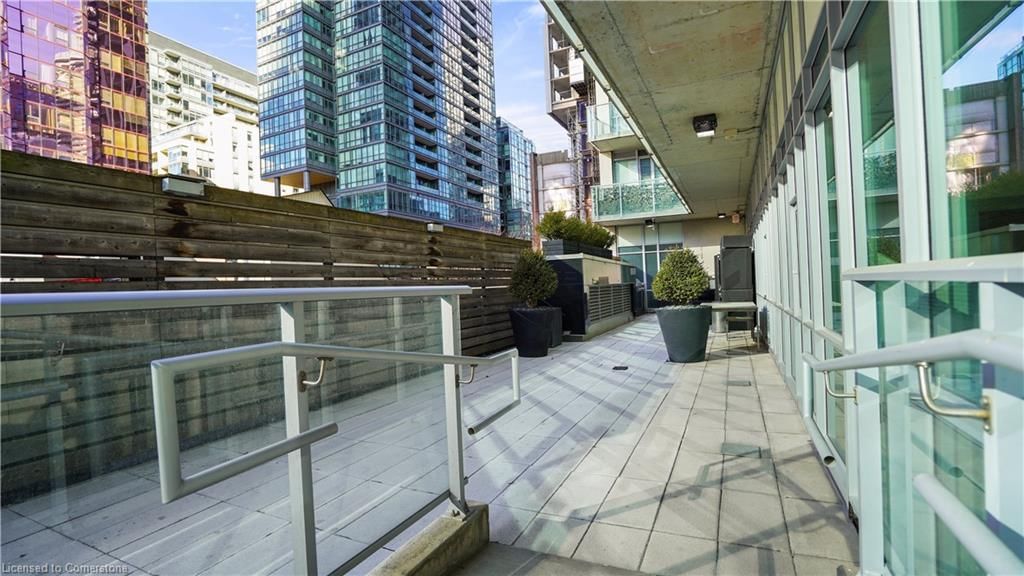
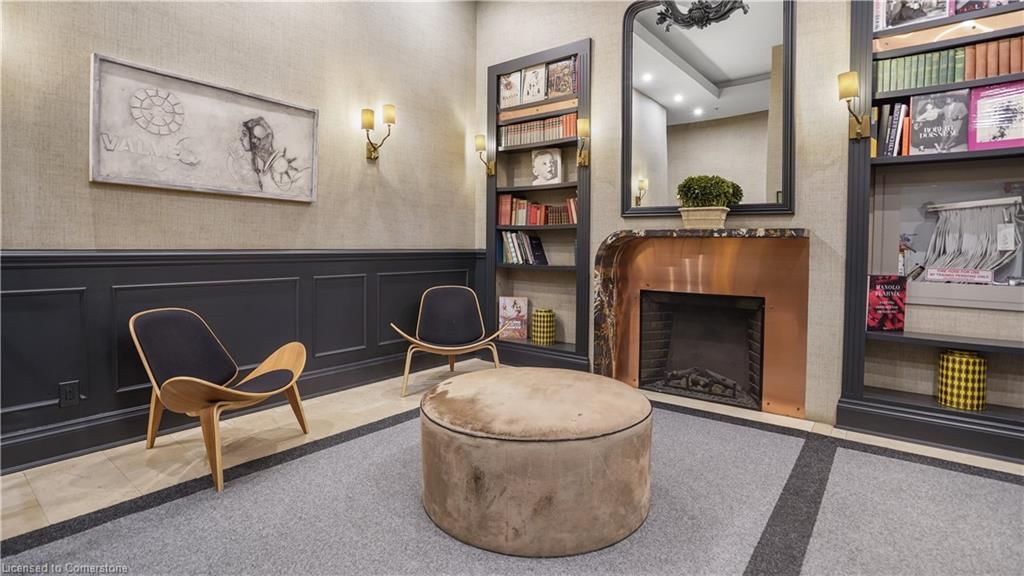
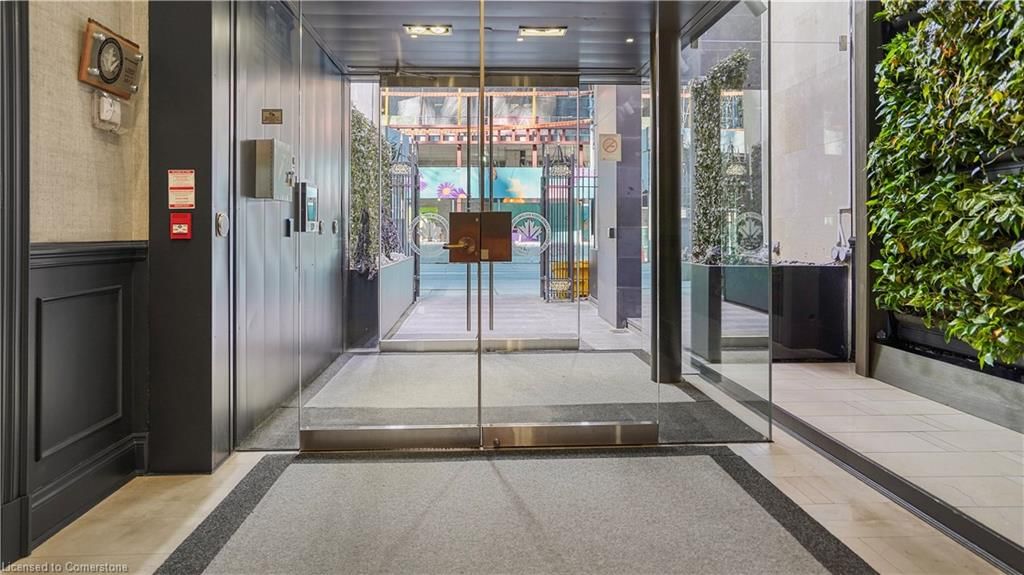
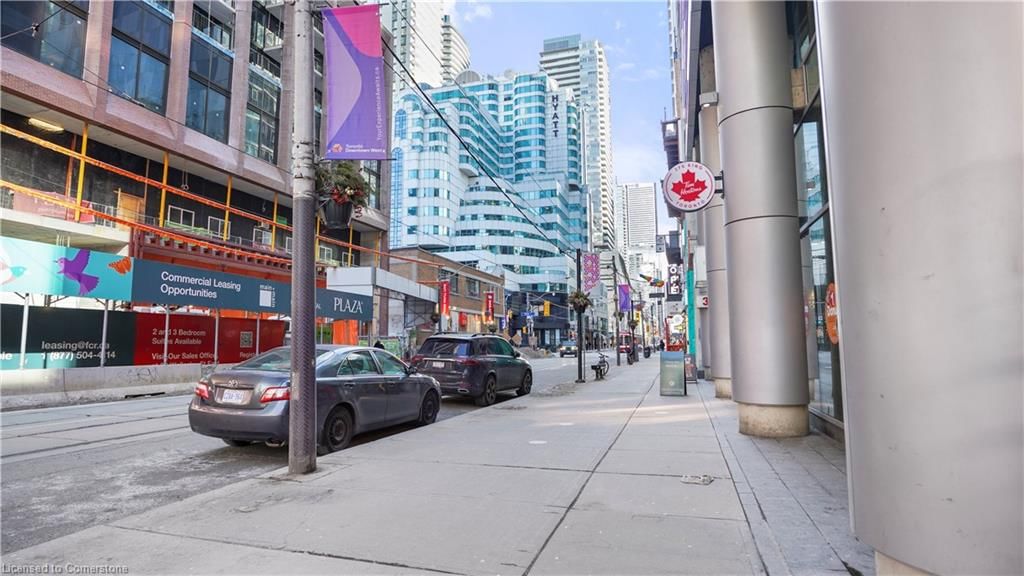
Your Downtown Haven at 2103-375 King St W – Lake Views & City Vibes Await! Ready to live in the heart of Toronto’s Entertainment District? This move-in-ready 2-bedroom, 2-bathroom condo offers over 760sq ft of comfortable, functional living space, complete with one parking spot and a locker for extra convenience. From the 21st floor, enjoy stunning views of Lake Ontario and the iconic Rogers Centre – a perfect blend of nature and city energy right outside your window. What Makes It Special: • Room to Breathe: Over 800 sq ft with 2 beds and 2 baths – ideal for roommates, small families, or a home office setup. • Unbeatable Location: Smack in the middle of the Entertainment District, you’re steps from lively restaurants, bars, theatres, and King West’s electric vibe. • Nearby Perks: Catch a game or concert at the Rogers Centre, take a lakeside walk, or explore hotspots like the CN Tower, Ripley’s Aquarium, and Queen West’s eclectic shops. • Practical Living: Comes with parking and a locker – rare finds in the downtown core! • Move-In Ready: No fuss, no fixes – just unpack and start enjoying. Imagine waking up to lake views, grabbing a bite at a nearby café, or strolling to a show – all from a home that puts Toronto at your doorstep. Perfect for anyone craving the downtown lifestyle without the hassle. Don’t wait – book your viewing today! 2103-375 King St W – Your Ticket to Toronto Living.
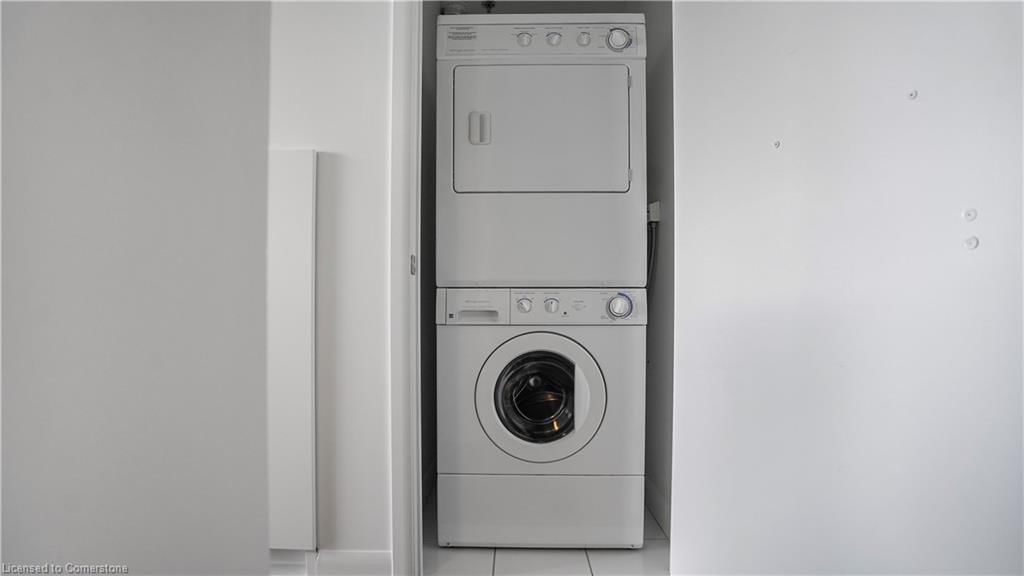
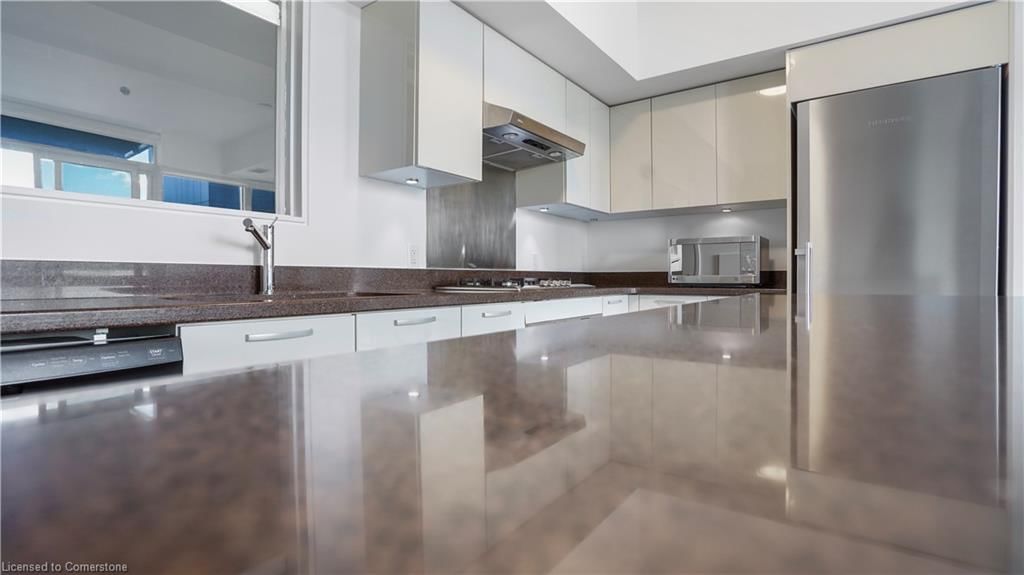
Carbon Monoxide Detector,Dishwasher,Dryer,Gas Stove,Microwave,Refrigerator,Stove,Washer
Copyright 2025 Information Technology Systems Ontario, Inc. The information provided herein must only be used by consumers that have a bona fide interest in the purchase, sale, or lease of real estate and may not be used for any commercial purpose or any other purpose.
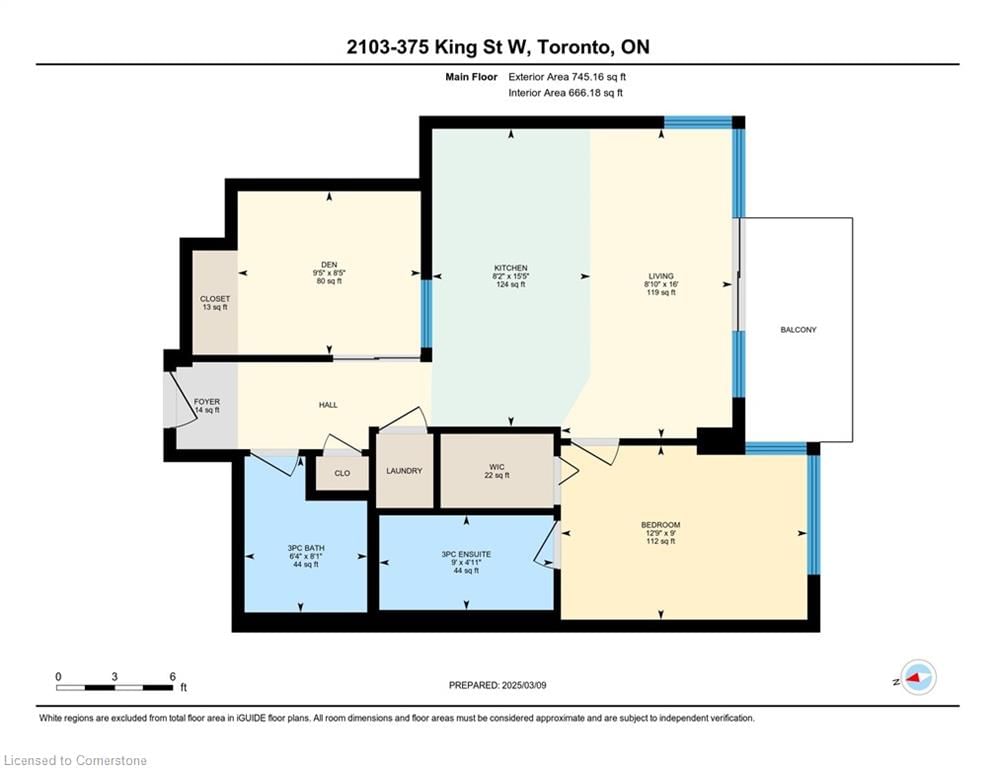
Living Room
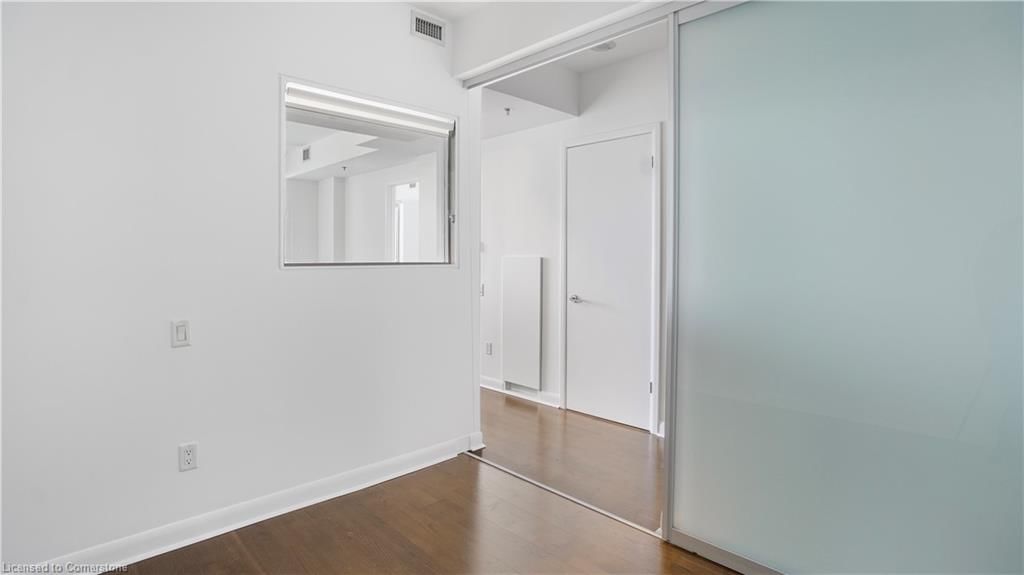
Den
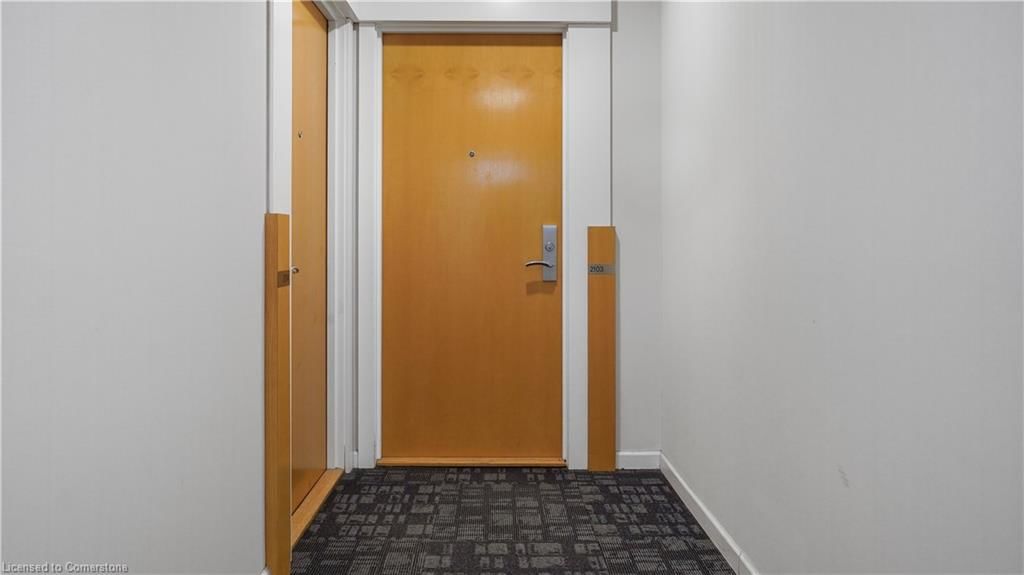
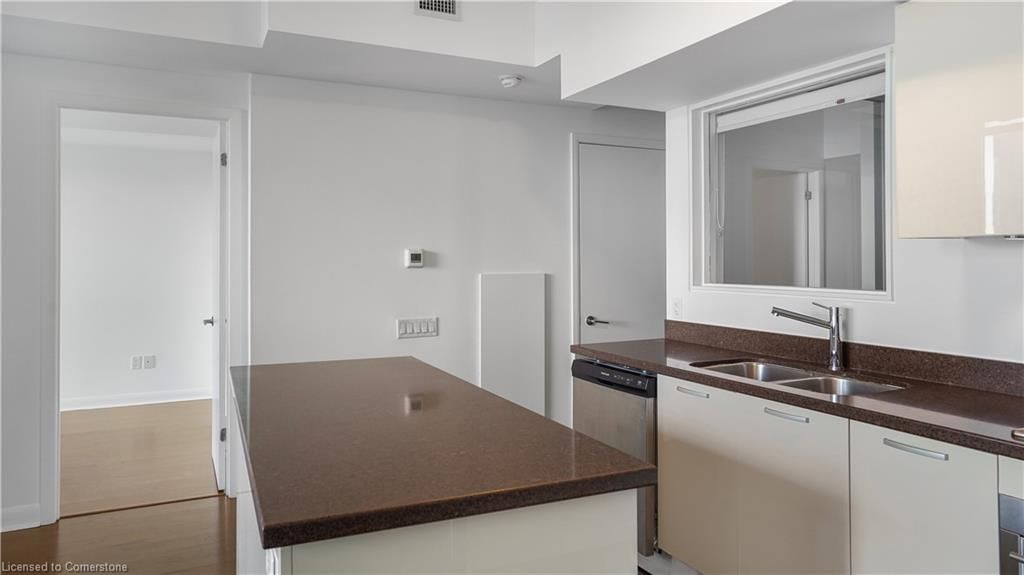
Kitchen
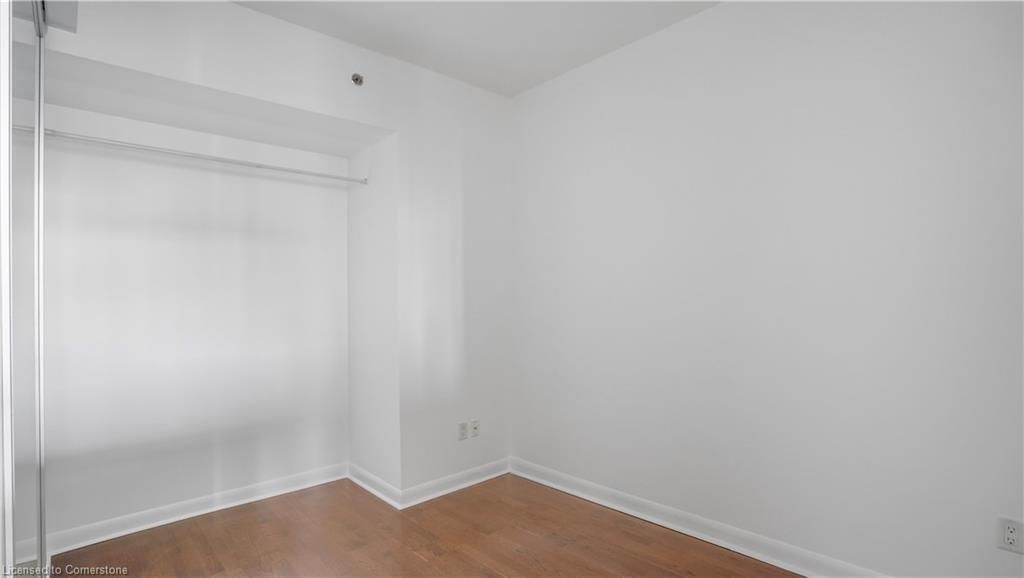
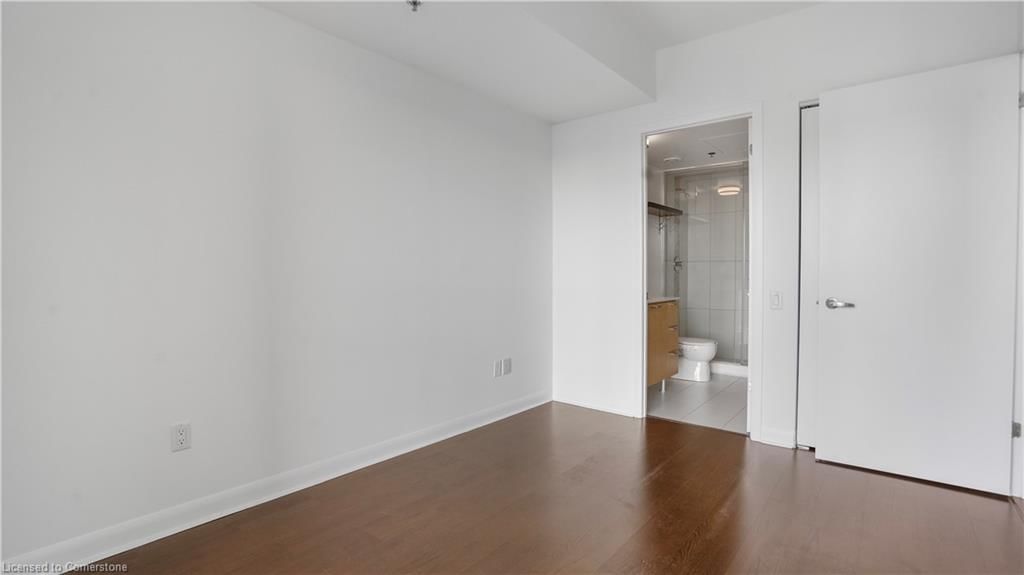
Bedroom Primary
Bedroom
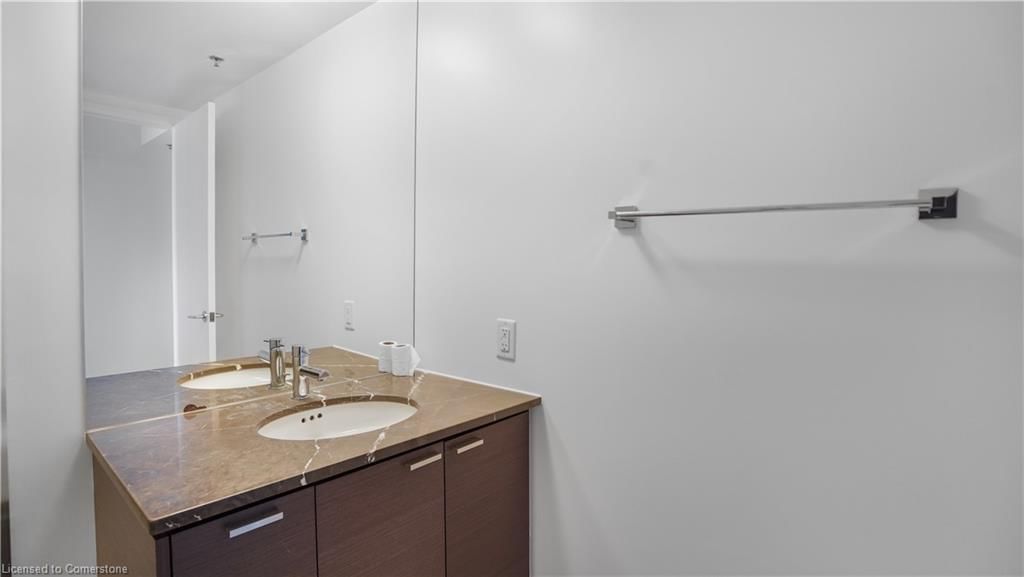
Bathroom
Bathroom
The graph below compares the average list price and average sale price of condos in this neighborhood by month for the last 24 months. When average sale price is greater than average list price, this may suggest a buyer's market. When average sale price is lower than the average list price this may suggest a seller's market.
The graph below illustrates the average days on market for condos in this neighborhood. The yellow area may indicate a buyer's market, the green area may indicate a balanced market and the red area may indicate a seller's market.
Sales Representative, Century 21 People’s Choice Realty Inc., Brokerage
(647) 576 - 2100
Toronto, Waterfront Communities C1, M5V 3Z7
Toronto, Waterfront Communities C1, M5V 0R1
Toronto, Waterfront Communities C1, M5J 3A4